The UK National Living Wage in 2026: a 4.1% rise to £12.71
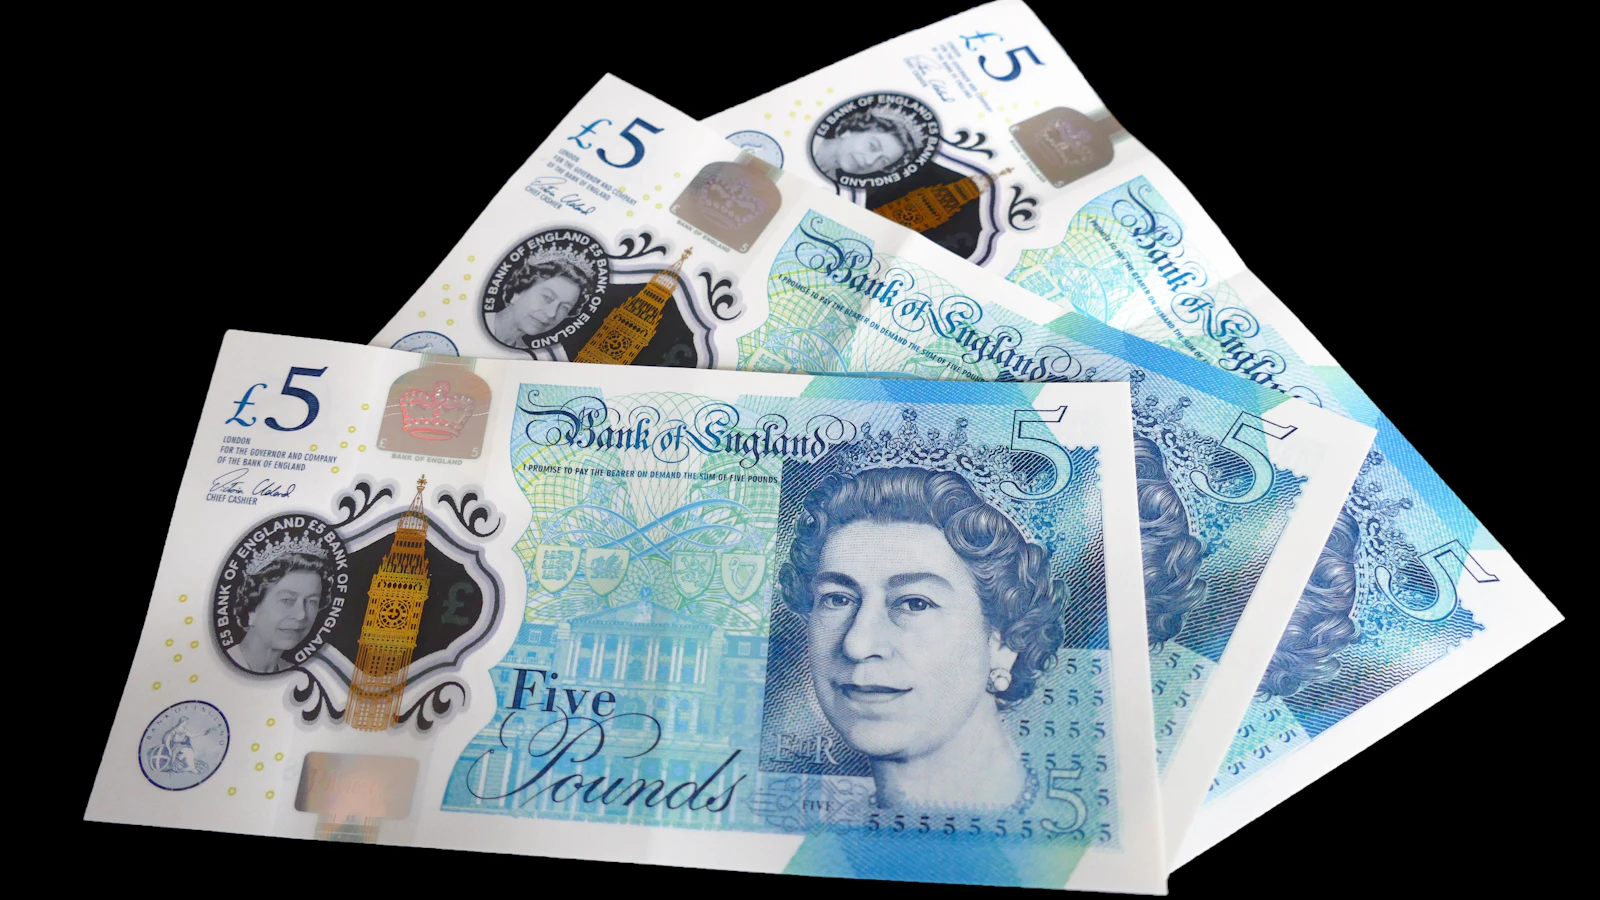
Photo by Anthony · Unsplash
April 2026 brings a smaller percentage rise than recent years for the over-21 rate, but a considerably larger one for 18-20-year-olds. Here is what full-time work is worth at each rate.
From 1 April 2026, the UK's National Living Wage rises 4.1% to £12.71 an hour for workers aged 21 and over. That is a smaller percentage increase than several recent years, but it sits alongside a considerably larger rise for younger workers: the 18-20 rate goes up 8.5%, more than double the over-21 percentage, continuing a deliberate policy to close the gap between age-based rates rather than an inconsistency in the announcement. Both changes take effect on the same date and apply automatically to every eligible worker, with no action required from either the employee or the employer beyond updating payroll for the new financial year.
The confirmed rates from April 2026
The Low Pay Commission recommends a rate to government each year, and the government accepted its recommendation in full for 2026:
| Age band | Rate from April 2025 | Rate from April 2026 | Increase |
|---|---|---|---|
| 21 and over (National Living Wage) | £12.21 | £12.71 | +4.1% |
| 18-20 | £10 | £10.85 | +8.5% |
| 16-17 and apprentices | £7.55 | £8 | +6.0% |
The accommodation offset — the maximum an employer can deduct for provided living accommodation before it counts against minimum wage compliance — also rises 4.1% to £11.10 a day. The confirmed figures are published directly on GOV.UK.
Why the over-21 rise is smaller than recent years
The National Living Wage has operated since 2024 against an explicit target: two-thirds of median UK earnings for workers aged 21 and over. That target was effectively reached with the April 2024 uprating, which is why the very large increases of 2023 and 2024 — 9.7% and 9.8% respectively — were not repeated in 2025 or 2026. Once the target is met, the rate simply tracks median earnings growth going forward rather than closing a gap, which produces a smaller, steadier annual percentage than the years spent catching up to the target.
Why younger rates keep rising faster
The 18-20 rate's 8.5% rise and the 16-17/apprentice rate's 6.0% rise are both considerably larger than the over-21 figure, and that gap is deliberate policy rather than a side effect. The government has stated an intention to narrow the difference between age-based minimum wage rates over time, on the reasoning that the same job performed by a 19-year-old and a 22-year-old increasingly commands the same pay in practice. The 18-20 rate has now risen from £7.49 in April 2023 to £10.85 by April 2026 — a 45% increase in three years, against a smaller proportional rise for the over-21 rate in the same period.
How today's rate compares with the last decade
Set against a longer run of years, the pace of increase since 2022 stands out clearly:
| April | National Living Wage |
|---|---|
| 2020 | £8.72 |
| 2022 | £9.50 |
| 2024 | £11.44 |
| 2026 | £12.71 |
The rate has risen by roughly 46% since 2020, considerably faster than general price inflation over the same six years, which reflects the explicit two-thirds-of-median-earnings target the government pursued over that period rather than a simple inflation link. Now that the target has been met, further rises track median earnings growth going forward, which is why the pace has settled into the smaller, steadier increases seen in 2025 and 2026.
What full-time work at the new rate is worth
Converting an hourly rate to an annual figure needs a stated number of hours, and the Low Pay Commission's own reference uses a 35-hour week rather than the 40-hour week assumed elsewhere:
| Rate | Annual (35 hrs/wk, LPC convention) | Annual (40 hrs/wk) |
|---|---|---|
| £12.71/hr (National Living Wage) | £23,122 | £26,437 |
| £10.85/hr (18-20) | £19,747 | £22,568 |
| £8/hr (16-17, apprentice) | £14,560 | £16,640 |
The gap between the two hours conventions is over £3,300 a year on the top rate alone — the assumed hours behind any annual figure matter as much as the hourly rate itself, whether comparing this year's rate to last year's or comparing two different roles. The full-time equivalent calculator converts any actual hours pattern into a standard comparison figure rather than borrowing either convention by default.
A separate, higher figure: the real Living Wage
The National Living Wage is a legal minimum set by government. It is a different figure from the voluntary "real Living Wage" set independently by the Living Wage Foundation and calculated from the actual cost of living, which employers can choose to pay but are not legally required to. That voluntary rate is set to rise to £13.45 an hour from 1 May 2026 — noticeably above the statutory £12.71 figure — and the two are easy to confuse given the similar names, despite one being a legal floor and the other a voluntary accreditation.
Checking pay is correct in practice
Underpayment of the minimum wage often comes from deductions rather than the headline rate being set incorrectly — a uniform cost, unpaid mandatory training time, or unpaid travel between sites during a shift can each quietly push an effective hourly rate below the legal floor even when the rate printed on a payslip looks correct. HMRC enforces minimum wage compliance separately from the rate-setting process and can order back pay plus a penalty of up to 200% of the arrears for confirmed underpayment. Anyone unsure whether their actual pay matches the rate they are entitled to can check both figures against their payslip and the hours genuinely worked, including any unpaid time that legally should count, rather than assuming the two automatically line up.
Sources
This is general information, not legal or financial advice. Minimum wage rates are reviewed annually and can change again from April 2027, following whatever the Low Pay Commission recommends and the government of the day chooses to accept. For a decision about a specific pay situation, check the current rates directly on GOV.UK.